Multi-Location Growth for dental & HEALTHCARE

Build locations that can stand on their own.

One office is packed and another is under-filled, but your marketing report says your traffic is up and your brand is doing fine.

A struggling office often has a visibility problem hiding underneath a healthy looking monthly report.

Tekkii measures every location against the competitors patients actually see in that specific market, and identifies the locations falling behind, and builds a separate growth plan for each one.

Scan My Locations Free Book My Pinpoint Audit
Real practice photo, dentist with patient, warm candid moment, no stock energy
Pin Parity Scoreboard 41-pt gap
Flagship
78
Location 2
62
Location 3
37

Example scores. Yours exist right now, whether you've seen them or not.

Real groups. Real locations. Real results.

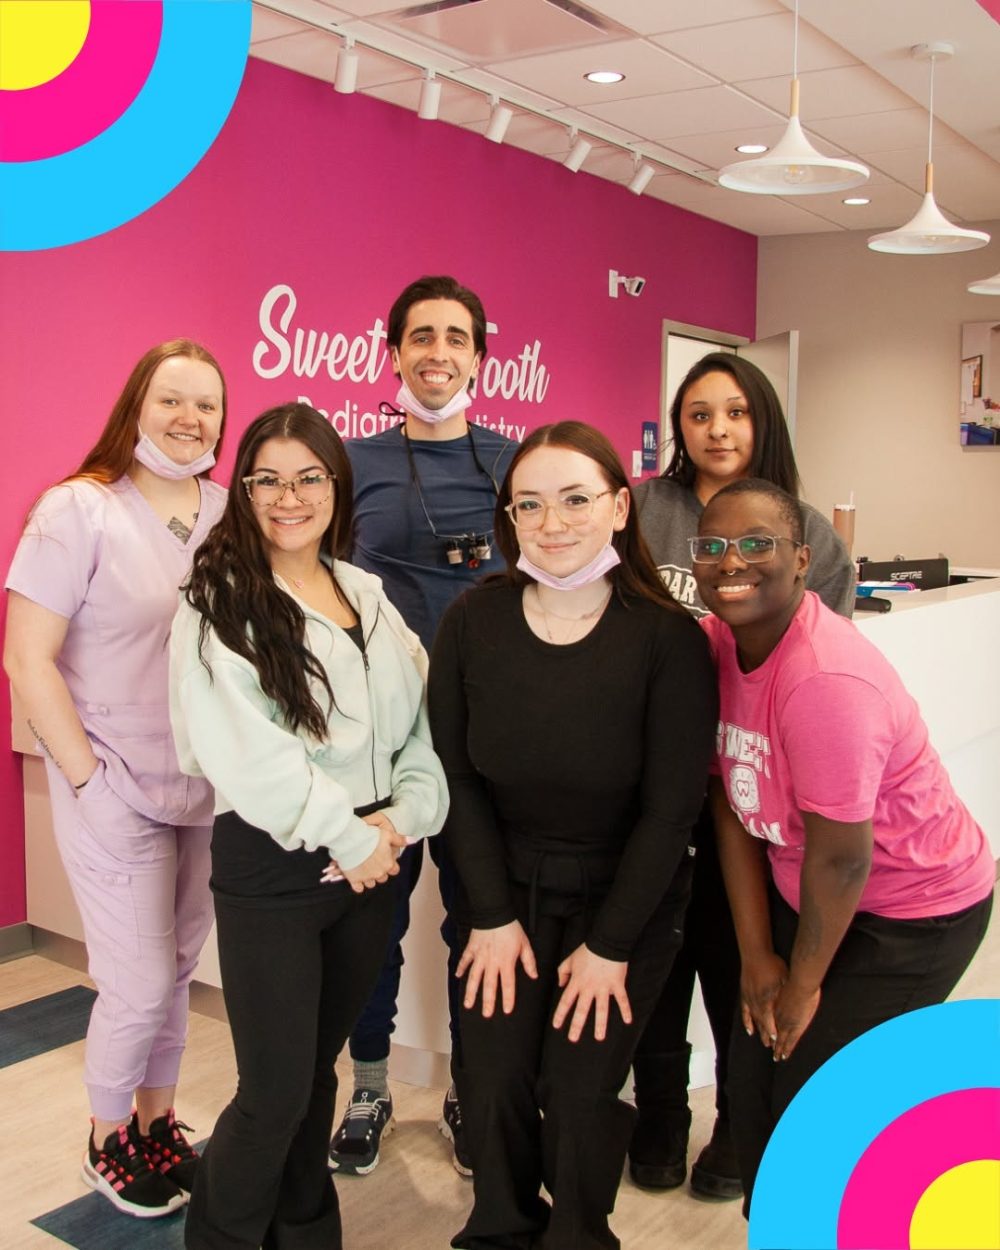
Sweet Tooth Pediatric Dentistry & Orthodontics

1 → 8
locations, 7 opened in the last 4 years
8 of 8
locations in the top 3 on Maps
~$10k/mo
cut from ad spend, on track for $100k reduced YoY
~100
net new patients over baseline added last month

“We ended last year with almost 6,000 new patients. In 2022 when I started, we had almost 4,000.”

— Karlee K., Sweet Tooth Pediatric Dentistry

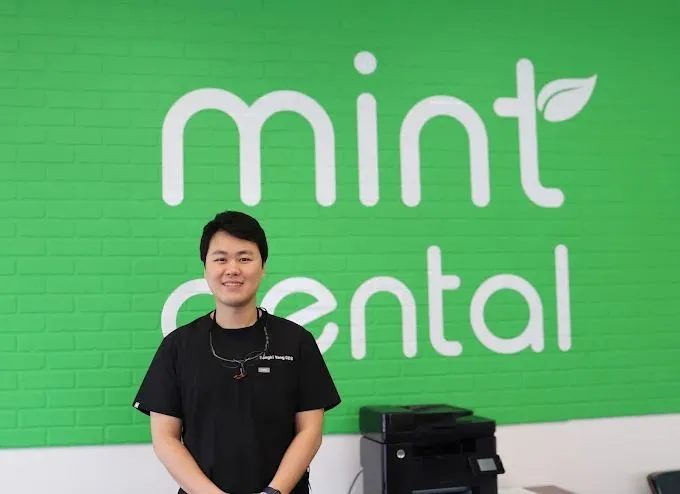
Mint Dental

2.5x
increase in implant production
4 of 4
locations in the top 3 on Maps, up from 2 of 4

“I don't think about marketing anymore because all of our locations rank pretty well.”

Dr. Yang, DDS
Mint Dental
Mint Dental office or team photo, real location, warm and candid
Sound familiar?

One thriving office can hide
one expensive problem.

One location thriving, one bleeding cash.

The office has capacity, but people nearby still aren't finding us.

I can't tell which office my marketing dollars are feeding.

You've probably already tried the usual fixes.

A general agency that treated your group as one overall brand. The struggling location was never addressed and improved against its own local competitors.

A website built around the brand only instead of the locations. Each location needs enough local relevance and service depth to gain visibility in its own market.

Paid ads covering up an organic weakness. Ads can create demand quickly, but they're expensive when the location underneath them isn't performing well organically. This keeps you stuck spending more and more.

More marketing poured into the wrong office. A full schedule doesn't need more demand that should be going to the under-served location.

“Is this happening in every group, or just mine?”

It's common once a practice expands beyond one location. Every office is in a different area with different competitors and market conditions, but most marketing systems still report the group as one account.

Here's how it actually works ↓

Local search is won location by location.

Every office competes in a different local search environment, against different practices, at different distances, for different patient searches. That's why we benchmark and work each location separately.

Rankings change by search location
#12 #3 #8 #5 20+ #2 #17 #5 Y

The same office can rank #2 here and disappear a few miles away.

Local Visibility

Each office's online visibility is improved to compete for the searches and patients that matter in its own market.

Local Authority

Reputation, website coverage and authority are built at the location level rather than averaged across the group.

Local Accountability

Every office gets its own baseline, priorities, progress target and performance reporting.

44%

of local search clicks go to the top map results. Outside that pack, a location is effectively closed to anyone searching for a dentist near them. This is expected to increase as more and more AI driven results take over local search recommendations.

Every location gets a Pin Parity Score from 0–100. It measures how that office compares with the strongest local competitors across Maps visibility, Google Business Profile strength, website coverage, local signals and authority.

It is not a revenue forecast. It's a competitive visibility benchmark.

14
points between the strongest and weakest office.

The average Pin Parity spread across multi-location dental groups we have scored.

More patients isn't always the answer

We grow the locations that actually need growth.

About 1 in 4 dentists say they're not busy enough (ADA Health Policy Institute). Plenty of others are at full capacity. A low visibility score doesn't automatically mean “buy more marketing.” Before we recommend where your group should invest, we weigh each office's score against its real capacity, including provider availability, open chair time, and your goals for growth.

Location A
VisibilityStrong
ScheduleFull
→ MAINTAIN

Protect the position. Don't buy demand it can't seat.

Location B
VisibilityWeak
ScheduleOpen capacity
→ GROWTH PRIORITY

This is where the next dollar goes.

Location C
VisibilityWeak
StaffingConstrained
→ FIX OPERATIONS FIRST

More calls to an office that can't answer them is wasted money, and we'll say so.

How it starts

Four steps. The first one is free and takes 3 minutes.

1

Scan Your Locations Free

See the score and competitive gap for your practice offices in minutes.

2

Review What Matters

If the scan reveals a meaningful gap, we'll ask a few questions about capacity, priorities and what you're already doing.

3

Run the Pinpoint Audit

We investigate each office in the group, determine which location deserves the next growth dollar, and present the findings live.

4

Start Where It Makes Sense

From here, start with one high-opportunity location or deploy the system across the group.

See which of your locations fill their own schedule.

Scan My Locations Free

The No Weak Location Guarantee

We guarantee what we control. We refuse to guarantee what we don't.

Every location starts with a baseline Pin Parity Score for its current visibility. Your agreement states, in writing, how much that score improves within six months. If a location misses its agreed milestone, you stop paying that location's monthly fee until it catches up.

A baseline score for every location, day one.
A stated improvement guarantee, per location.
Miss the number and don't pay for that location until it hits.
No patient-count or revenue promises.

Start where your scoreboard says to start.

The core program

Grow

Every location stands on its own. Its own engine, its own score, its own written target and real strategy.

Dominate

The growth partnership for expanding groups. Open your next location with confidence while expand your brand.

Founder headshot, candid working shot, real person, direct eye contact

10+ years building local growth systems, now aimed at private practice expansion.

- David Jackson

Built by marketers. Run by a system. Accountable to people.

We built our own technology to help multi-location owners identify gaps, close them with precision, and grow all of their locations with clarity, because “trust us, it's working” isn't good enough.

Every location runs through the same Tekkii operating system. Measure the market, diagnose the gap, prioritize the work, execute, verify, and escalate when a location falls behind.

Straight answers.

Can you guarantee us new patients?

No, and be suspicious of anyone who will. New patient counts depend on your phones, your schedule, and your operations. A marketing company can't control any of that. What we control is visibility, so we guarantee the Pin Parity Score, in writing and for each of your locations. If we don't hit the defined goal for an office in 6 months don't pay that location's fee until it hits.

What does the free scan show?

One location, scored 0 to 100 against the strongest competitors in that office's market, and the gaps that put it there. About three minutes with results on screen. You can run a second location free as well, and the gap between two of your own offices is usually the most useful number you'll see. The full, more detailed group-wide report is the Pinpoint Audit.

We've been burned by agencies before. Why is this different?

Because everything is measured per location, on public Google data you can check yourself, against a written target. Each location receives a baseline score on day one and a stated improvement score by month 6.

What is the Pin Parity Score?

A per-location score based on public Google data and real visibility signals that contribute to organic rankings against competition in that market. The score goes from 0 to 100. The higher the number, the better the performance of the location. One glance tells you which offices fill their own schedule and which need work.

What happens at the Pinpoint Audit?

Our full-depth diagnosis across every location, presented live. In one meeting you know exactly which location should receive your next marketing dollar, and why.

Can we start with only one location?

Yes. Many groups start with the weakest office that is struggling or even unprofitable; the rest of the group stays visible on your scoreboard either way.

What if one of our locations is already at capacity?

Then we'd tell you not to market it. Demand pointed at an office that can't absorb it becomes missed calls and longer waits, not new patients. That's why we ask which location most needs patients and whether it's actually taking them. A score only matters if there's room to fill.

Do you work with single-location practices?

We specialize in multi-location groups, and selectively work with single locations that are credibly heading towards growth and opening a second location.

Do we need a new website?

This depends on the gap between your website and achieving your growth goals as determined in a full Pinpoint Audit. Grow and Dominate programs include the site or heavy optimizations because it's part of what makes locations rank.

Find out which of your locations stand on their own.

Which offices fill their own schedule, and which are invisible. Every location scored 0 to 100, in about 3 minutes, results on screen.

Scan My Locations Free

We take one practice specialty per metro. Your market may or may not still be open.